How to build your own Marketing Catalyst: the secret weapon behind Diageo’s brand growth
How do you know whether to invest in TV, social or retail? Diageo’s Marketing Catalyst shows how smart brands allocate budgets strategically based on ROI, brand growth and context. This blog explains step by step how to develop a tool like this yourself — and why it prepares your marketing decisions for the future.
The best brands do not grow by accident. They invest purposefully, intelligently and measurably, knowing where each marketing euro delivers the greatest return. This takes creativity and a solid foundation of data and models.
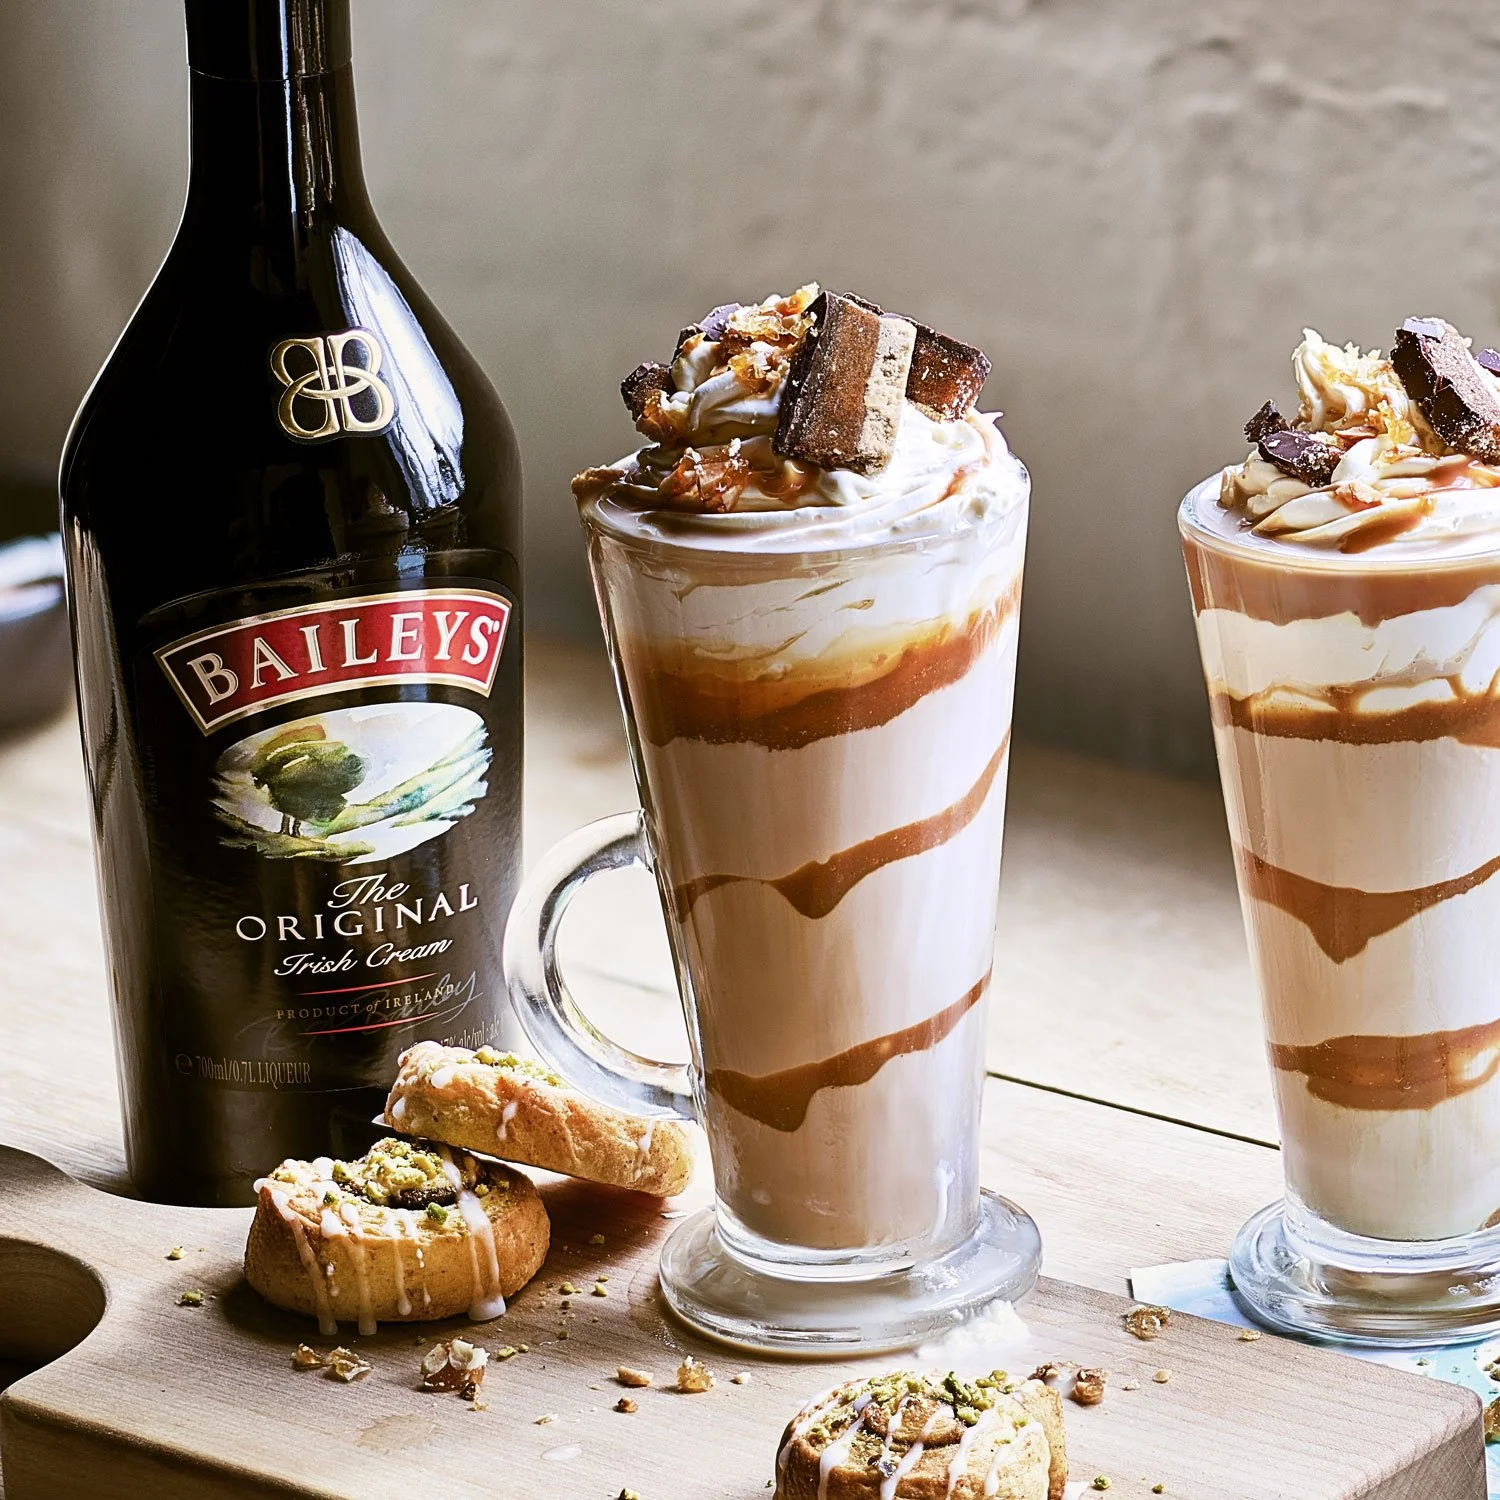
One of the most impressive examples comes from Diageo, known for Guinness, Baileys, Smirnoff, Johnnie Walker and Tanqueray, among others. It developed its own strategic tool: Marketing Catalyst. Each year, it uses the tool to allocate budgets across brands, markets, channels and campaigns, and predict which combination will deliver maximum growth.
At BrandQs, we increasingly hear this question:
“Can we build a tool like that too?”
The short answer: yes, provided you know where to start.
This blog explains, step by step, how to develop a Marketing Catalyst-style system adapted to your own scale and data.

Whether you work for a major brand, a B2B business or a fast-growing SME, this approach helps you get more impact from every marketing budget.
1. Define the objective and scope
Objective: Help marketing teams decide how much to invest, where best to invest it and what results to expect.
Define the scope:
Time horizon: annual planning versus campaign optimisation
Channels: TV, digital, social, out-of-home, in-store, sponsorship
KPIs: sales uplift, brand growth, cost efficiency (CPC, CPM), long-term effects
2. Gather the right data
You need detailed historical data from several areas:
Media investment & impressions
By channel, format, market, brand and time period
Including paid, owned and earned media
Campaign performance
Clicks, views, conversions, CTR, CPM, reach and frequency
Any sales uplift through e-commerce or retail
Brand health
Brand awareness, consideration, preference
Data from tracking studies, such as Kantar or other research agencies, potentially through BrandQs
Sales & revenue
Weekly or monthly sales figures by brand, channel or market
Contextual variables
Seasonality and cultural occasions, such as Easter, Christmas, Back to School, Halloween and Saint Nicholas
Competitor activity
Pricing strategies and promotions
Delayed effects
The impact of past media investment on current brand or sales results
3. Build the model — the tool's core
This is the technical heart. You need a combination of:
Marketing Mix Modelling (MMM) — for long-term analysis
Macro-level regression analysis, classical or Bayesian
Measures each channel's contribution to brand and sales growth
Provides incremental ROI by channel, brand and market
Multi-Touch Attribution (MTA) — for digital and short-term effects
Follows individual users across their touchpoints
Ideal for social, search and programmatic
Lift tests / regional A/B tests
For example: a test market or region with TV/radio versus one without
Provides causal evidence of investment effects
The strength lies in combining all these models into one decision engine.
4. Develop the platform — the user interface
Once the model works, marketers need to be able to use it.
Interface components:
Scenario planner: “What if we shift 10% from TV, radio or bus shelters to social?”
ROI dashboard by channel & market
Saturation curves (diminishing returns)
Campaigns by occasion (holidays, promotional moments)
Export options (Excel, Power BI, Tableau)
Technologies:
Back end: Python, R, SQL
Front end: Tableau, Power BI or custom-built with Streamlit, Shiny or React
Cloud: AWS, Azure or GCP
5. Calibrate, test and train
Backtesting: compare model output with historical reality
Refine where needed based on business feedback
Train teams to interpret the insights correctly
Build trust: this involves data and a change in decision-making
6. Ensure governance and continuity
Update the models quarterly or annually with new data
Connect live data from other tools such as Sensor or CRM
Establish a centre of excellence to safeguard the methodology
Ready to make smarter marketing decisions?
A tool such as Marketing Catalyst is the result of clear choices, smart data and a vision of what works. Whether you are starting with marketing optimisation or already using advanced dashboards, it is worth building a system that strengthens your marketing intuition with data insights.
At BrandQs, we help brands do exactly that:
Structure data
Build ROI models
Develop clear dashboards
And above all: make marketing budgets deliver better returns than ever
Want to know what this could look like for your brand or organisation?
Book an exploratory conversation without obligation, tailored entirely to your needs.
📩 Contact BrandQs. Smarter marketing starts here.

English version of the BrandQs archive. Historical references are preserved.